
I. Building Materials Industry Prosperity Index in September
In September 2025, the Building Materials Industry Prosperity Index (MPI) reached 105.6 points, remaining above the critical threshold and within the prosperity zone. This was an increase of 4.4 points from August and 0.2 points higher year-on-year, indicating continued recovery momentum in industry performance.
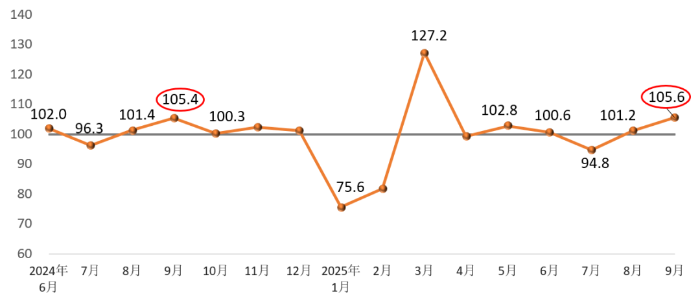
( Monthly Building Materials Industry Prosperity Index)
On the supply side: The Price Index for the building materials industry remained below the threshold, while the Production Index stayed above it. Specifically, the Price Index recorded 99.8 points, up 0.8 points from the previous month, and the Production Index reached 105.8 points, up 3.6 points. Overall, product prices declined month-on-month but at a slower pace, while production activity improved further.
On the demand side: The Investment Demand Index and Industrial Consumption Index were both above the threshold and in the prosperity zone, while the International Trade Index fell below the threshold and into the contraction zone. The Investment Demand Index registered 106.4 points, up 6.3 points from last month, reflecting continued recovery in investment. The Industrial Consumption Index was 104.5 points, up 2.1 points, showing sustained recovery in demand from downstream manufacturing sectors. In contrast, the International Trade Index fell to 98.4 points, down 0.4 points from August, indicating a decline in foreign trade volume. Overall, September saw steady growth in investment and industrial consumption demand, while international trade demand weakened.
II. MPI Influencing Factors and Market Outlook
■ Faster production in building materials.
Although new real estate starts remained weak, the easing of high-temperature and rainy weather conditions, coupled with stronger macroeconomic policy support, boosted downstream demand in related manufacturing industries. As a result, production in the building materials sector accelerated compared with July and August. All 13 subsectors in the industry recorded Production Indices in the prosperity range, with wall materials, clay and sand & gravel mining, construction stone, and mineral fibers & composites showing stronger rebounds.
■ Narrowing decline in product prices.
In September, product prices rose month-on-month in 8 subsectors—including waterproof materials, lightweight building materials, lime and gypsum, clay and sand & gravel mining, construction stone, mineral fibers & composites, sanitary ceramics, and non-metallic minerals—5 more than in August. Prices fell in cement, concrete and cement products, and wall materials. On a year-on-year basis, prices in clay and sand & gravel mining, construction stone processing, and sanitary ceramics remained higher. Overall, building materials prices continued to show low-level fluctuations, with narrower declines compared with previous months.
■Cautious market outlook.
Since September, macroeconomic conditions have shown moderate improvement, coupled with interest rate cut expectations, which boosted positive sentiment among building materials enterprises. However, according to data from the National Bureau of Statistics, construction and installation fixed asset investment fell by 2.2% year-on-year in January–August, with the decline widening. Infrastructure investment grew by 2.0%, but at a slower pace. Production growth in automobiles, rolling stock, solar cells, and electronic appliances also slowed. Overall demand for building materials remains weak and requires cautious assessment.
Meanwhile, recent declines in coal, natural gas, and other fuel prices have helped reduce costs for building materials enterprises, providing some relief on the supply side.
Annotations:
1. Building Materials Industry Prosperity Index (MPI)mainly monitors the operation trend of building materials industry and has a strong function of prediction and early warning. When MPI is higher than 100, it indicates that the operation of building materials industry is in the prosperity range, and when MPI is lower than 100, it indicates that in the recession range.
2. The prosperity index of building materials industry (MPI) judges the operation trend of building materials industry from the supply side and demand side. The supply side is divided into price index and production index. The demand side is divided into investment demand index, industrial consumption index and building materials international trade index according to the actual impact of the demand field on the building materials industry.
3. The price index of building materials industry reflects the change trend of ex-factory price of building materials industry. The ex-factory price does not include the expenses, product profits and taxes incurred in the circulation of building materials products. The ex-factory price is different from the market price, for the changes of the two will affect each other and there is a time lag. There may be inconsistent change trends in a certain period of time.
4. The industrial production index of building materials reflects the change trend of industrial production of building materials, excluding price changes.
5.Investment demand index, reflecting the change trend of investment market demand related to building materials.
6.The industrial consumption index reflects the changing trend of industrial consumption demand related to building materials. Industrial consumption includes not only the internal and inter industry consumption of building materials industry, but also the consumption of building materials products by downstream industries.
7.The international trade index of building materials reflects the changing trend of international trade in building materials, which is mainly composed of export indexes of building ceramics and sanitaryware, building technology glass, building stone, glass fiber and composite materials, non-metallic minerals and other industries.
Editor: Zhang Hanwen
Reviewer: Shen Yulu, Li Yuemei